AWARD-WINNING · BUILT BY SCIENTISTS · PATENT-PENDING · CANADIAN 🇨🇦
Evidence for today’s world
WATCH: GET STARTED
✓ Build rigorous datasets
✓ Automate analytical reports
✓ Continuously update insights
✓ Collaborate effectively
✓ Keep evidence up to date
→ Earn trust. Advance your mission.


When demand for trusted results outpace capacity, eOceans is the purpose-built system that handles data-backed workflows automatically — from team onboarding and data management to data validation, analysis, mapping, visualization, reporting, communication and publication.
Work within your team or collaborate across sectors
Results in moments, not months
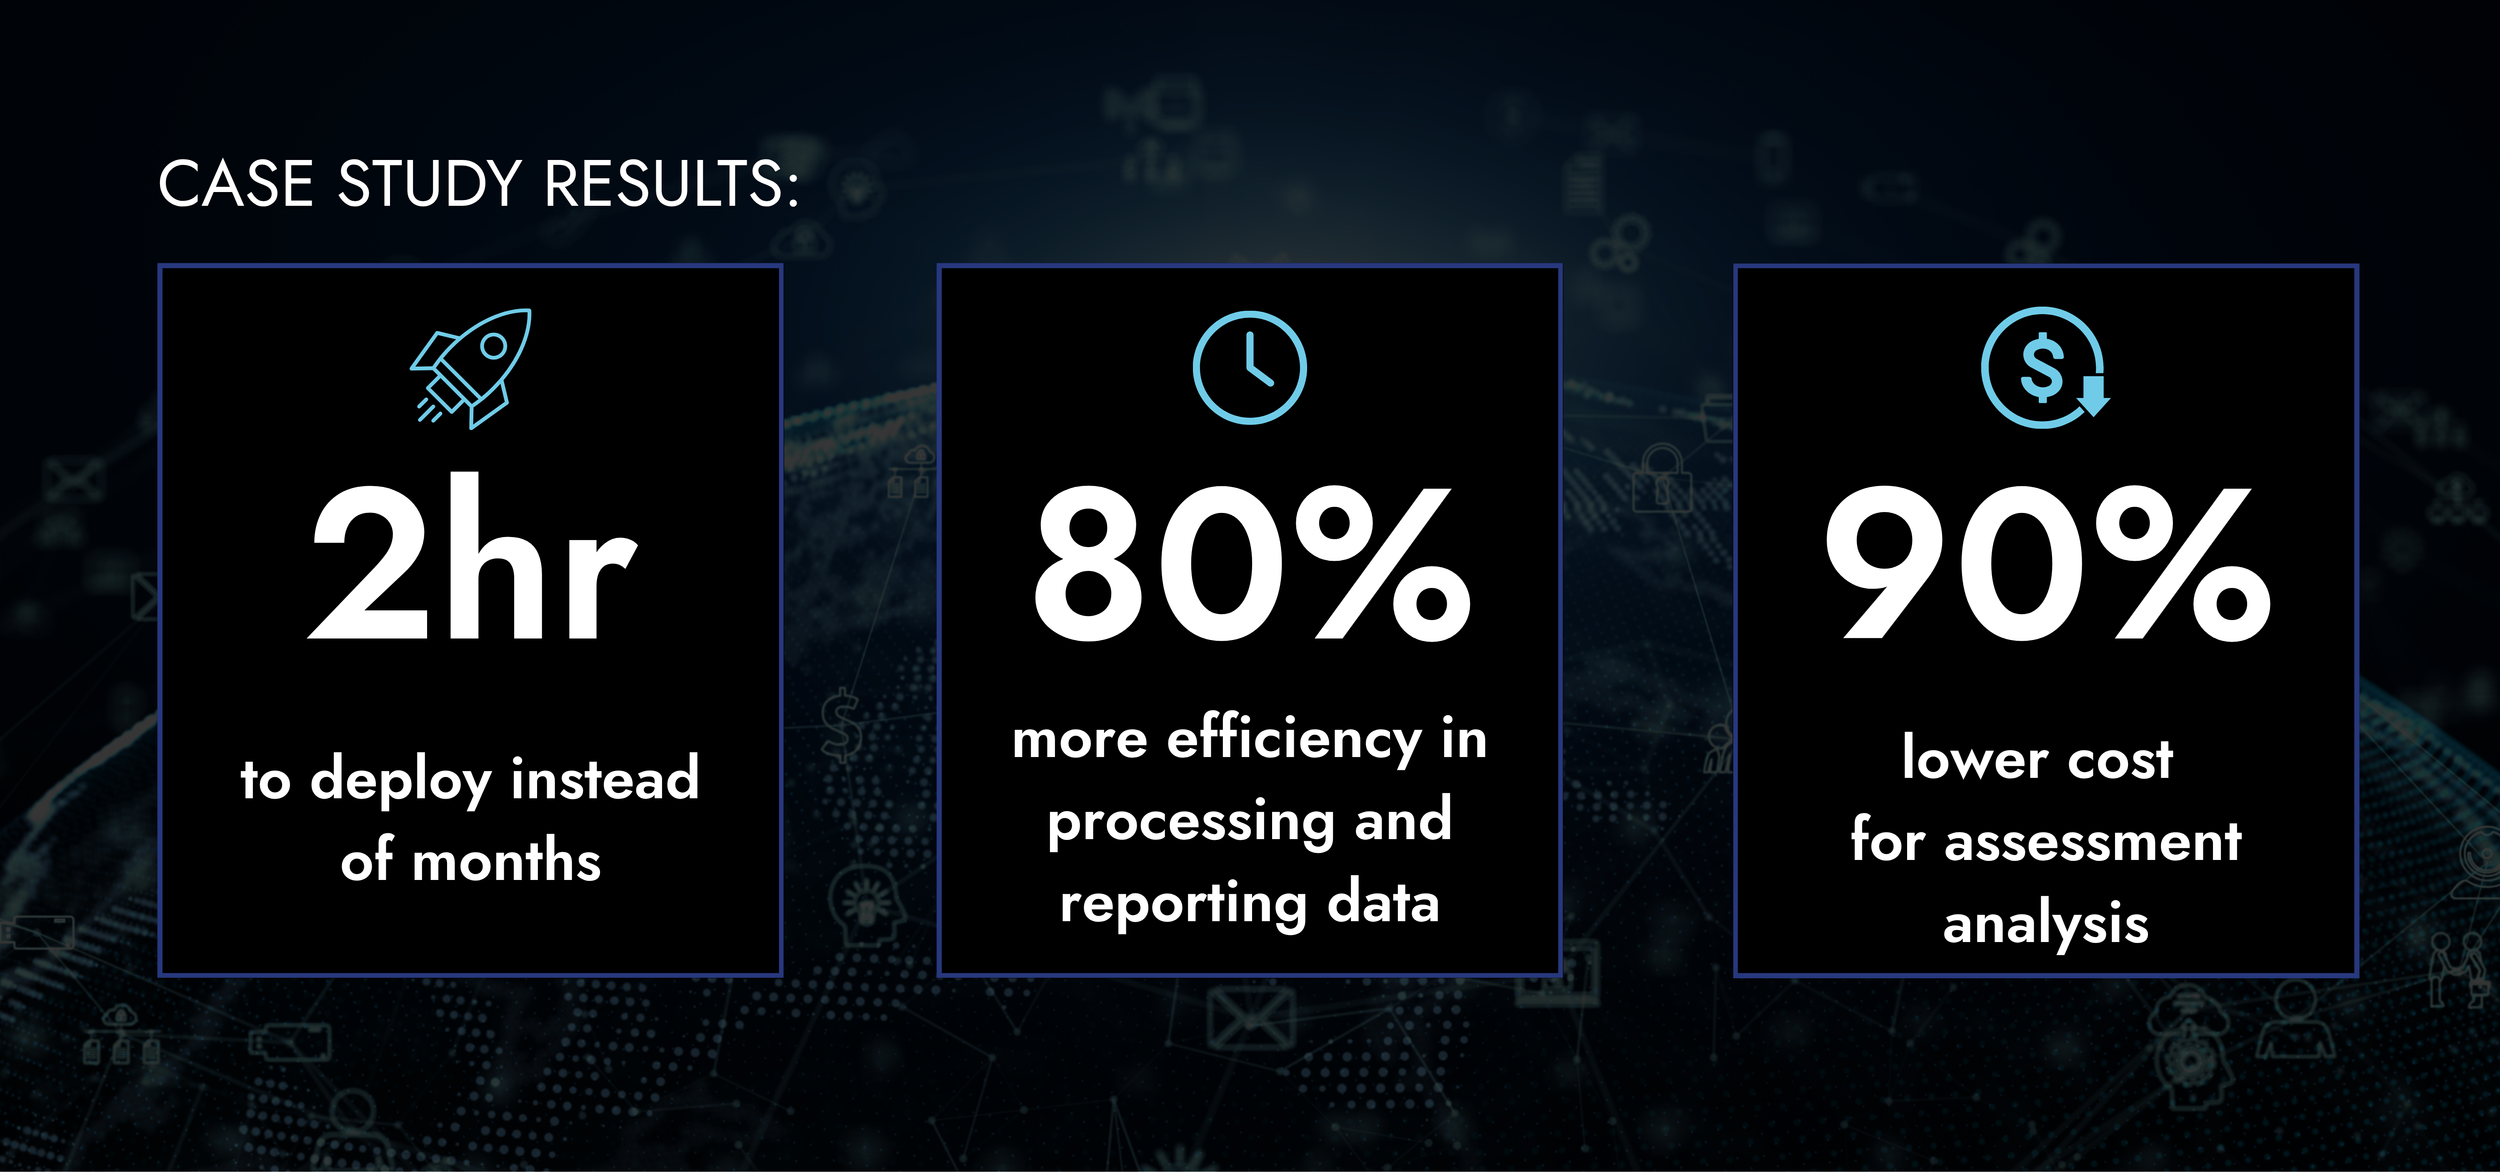
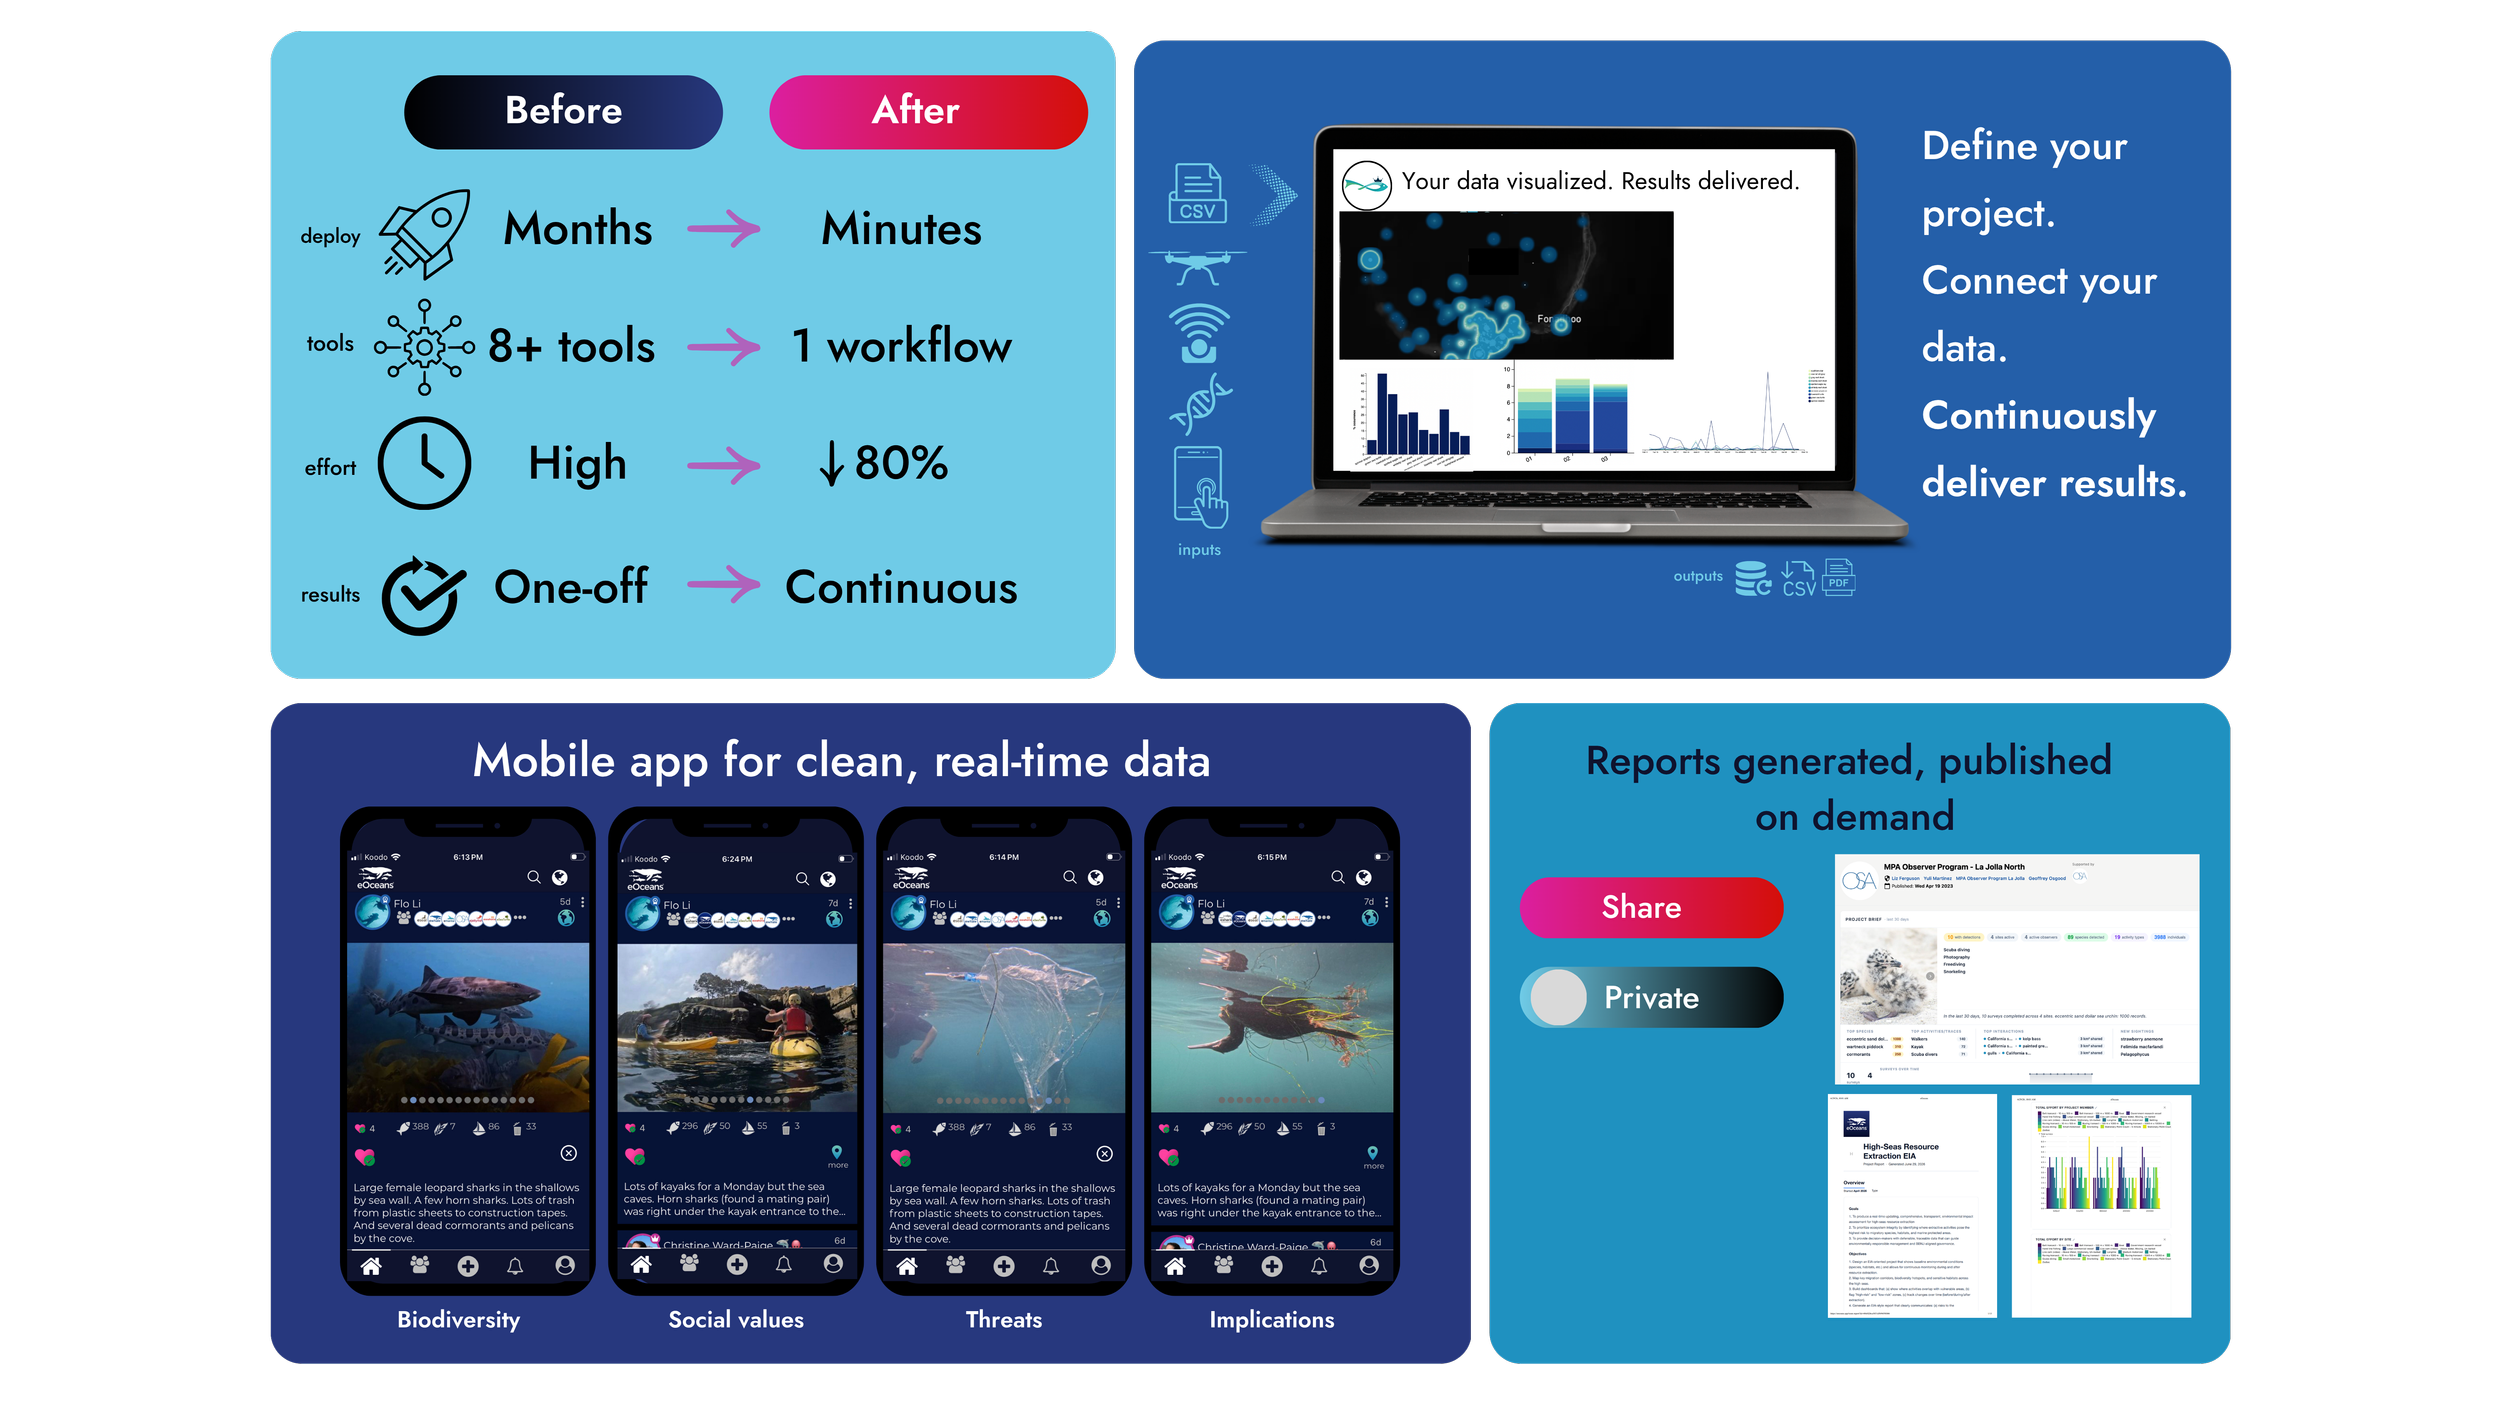
Launch complete data-to-analysis-to-report workflows in minutes—no spreadsheets, coding, or GIS needed. Collect, manage, validate, analyze, and report your data—all in one place.
Customized to your work
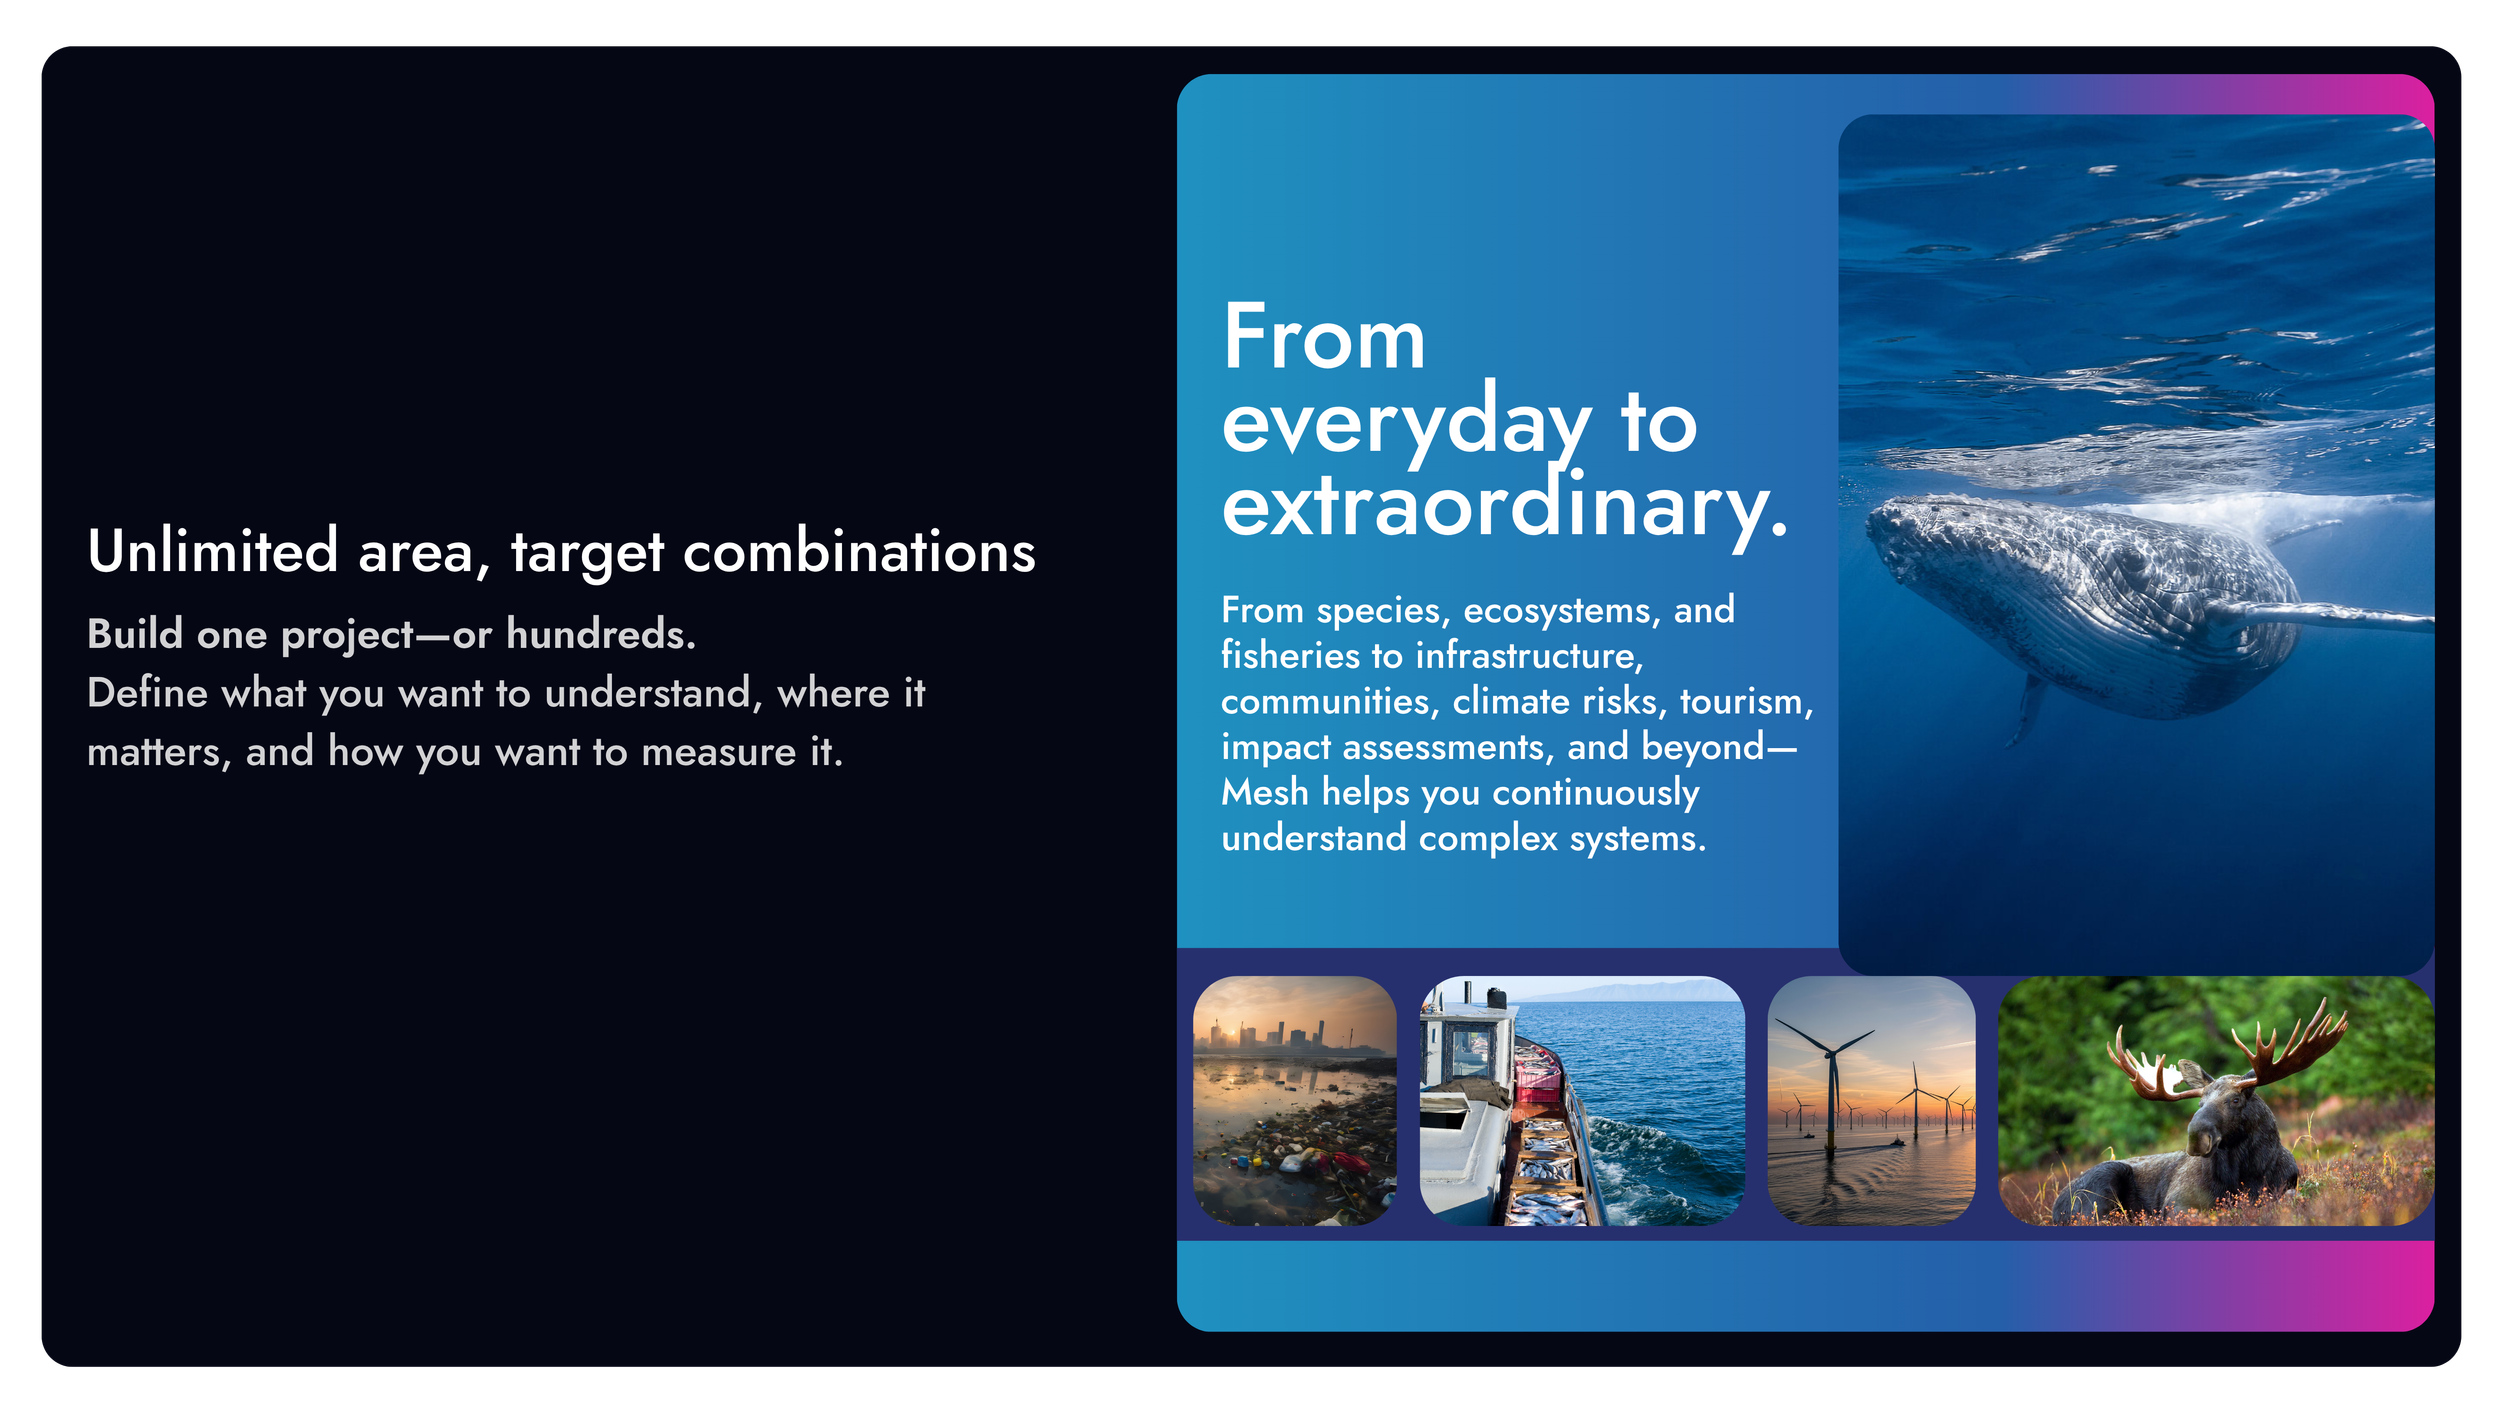
Every project is unique. Configure your objectives once, then let eOceans continuously transform your data into up-to-date evidence—revealing trends and patterns across space and time, with maps, analysis, and reports generated as your data grows.
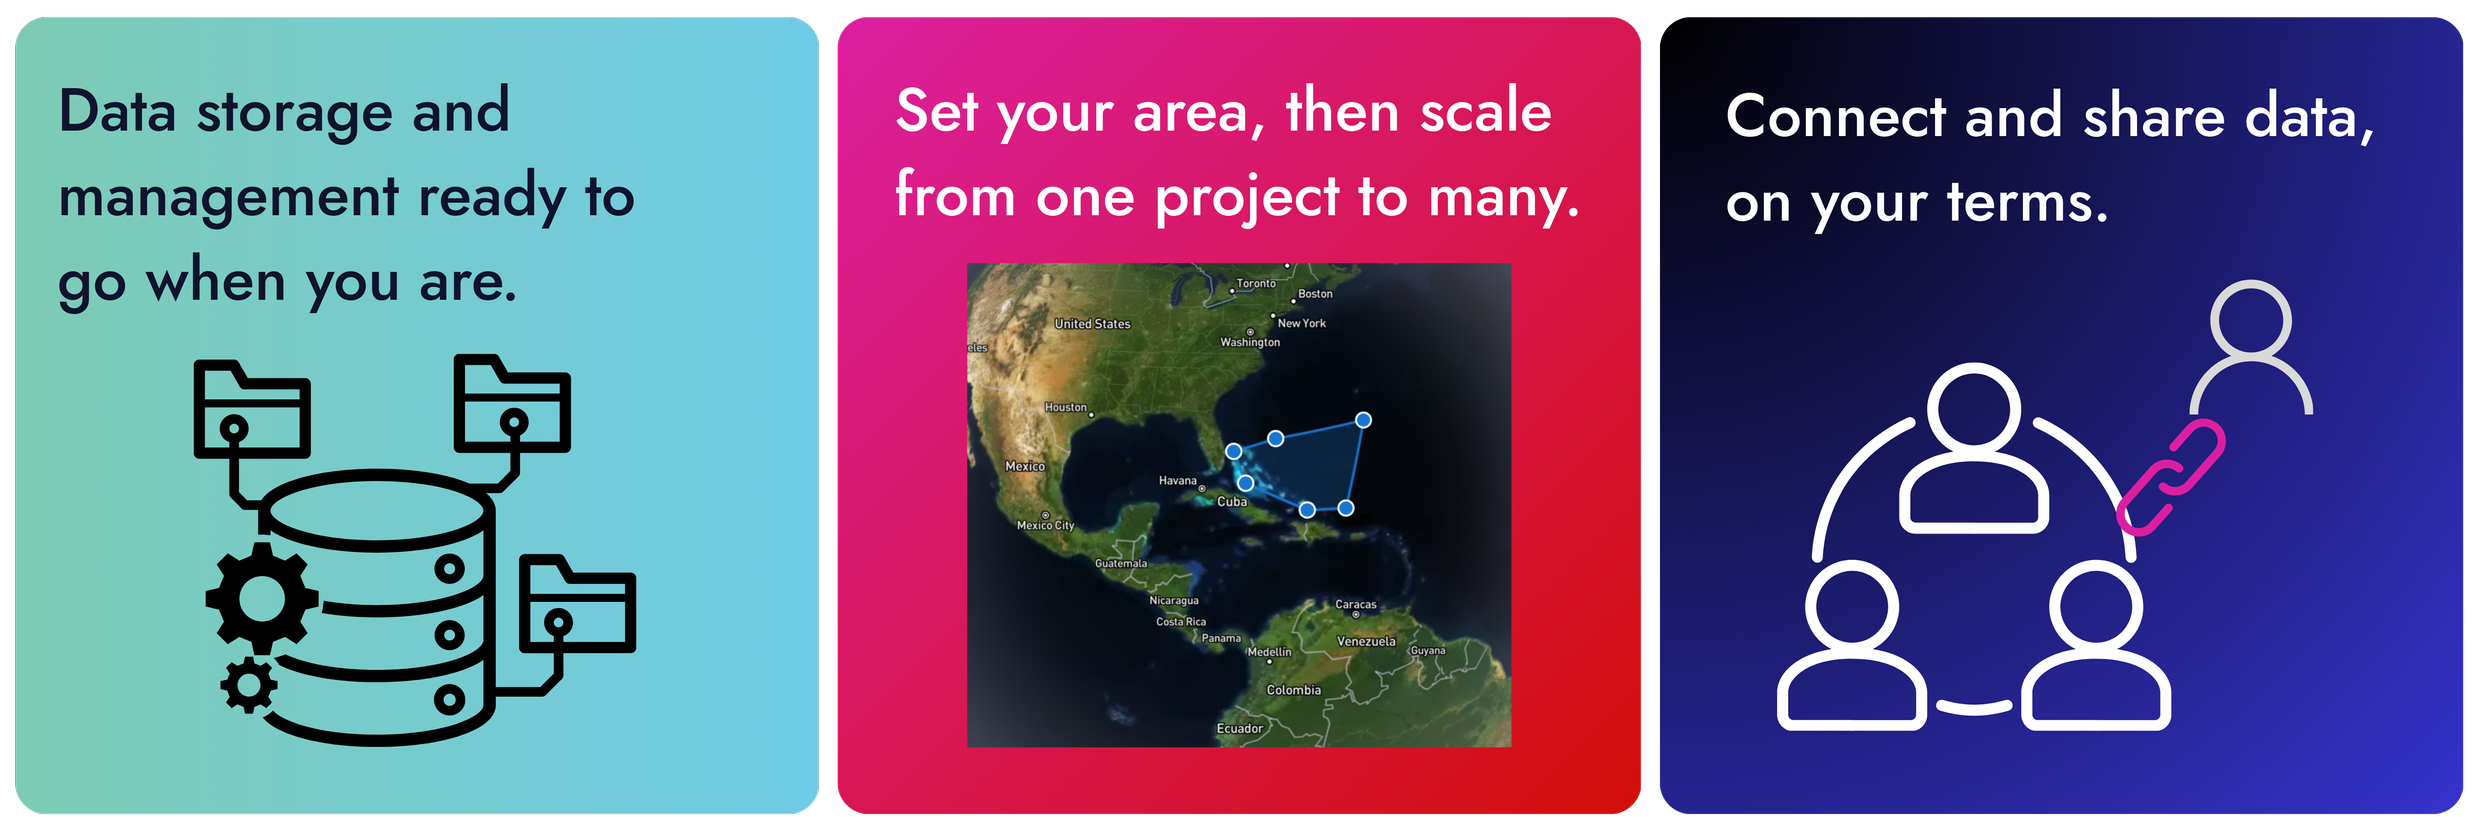
Ready whenever you are
Start collecting evidence when you need it and keep going. Continuously add trusted data as it becomes available to keep your results and reports up to date.
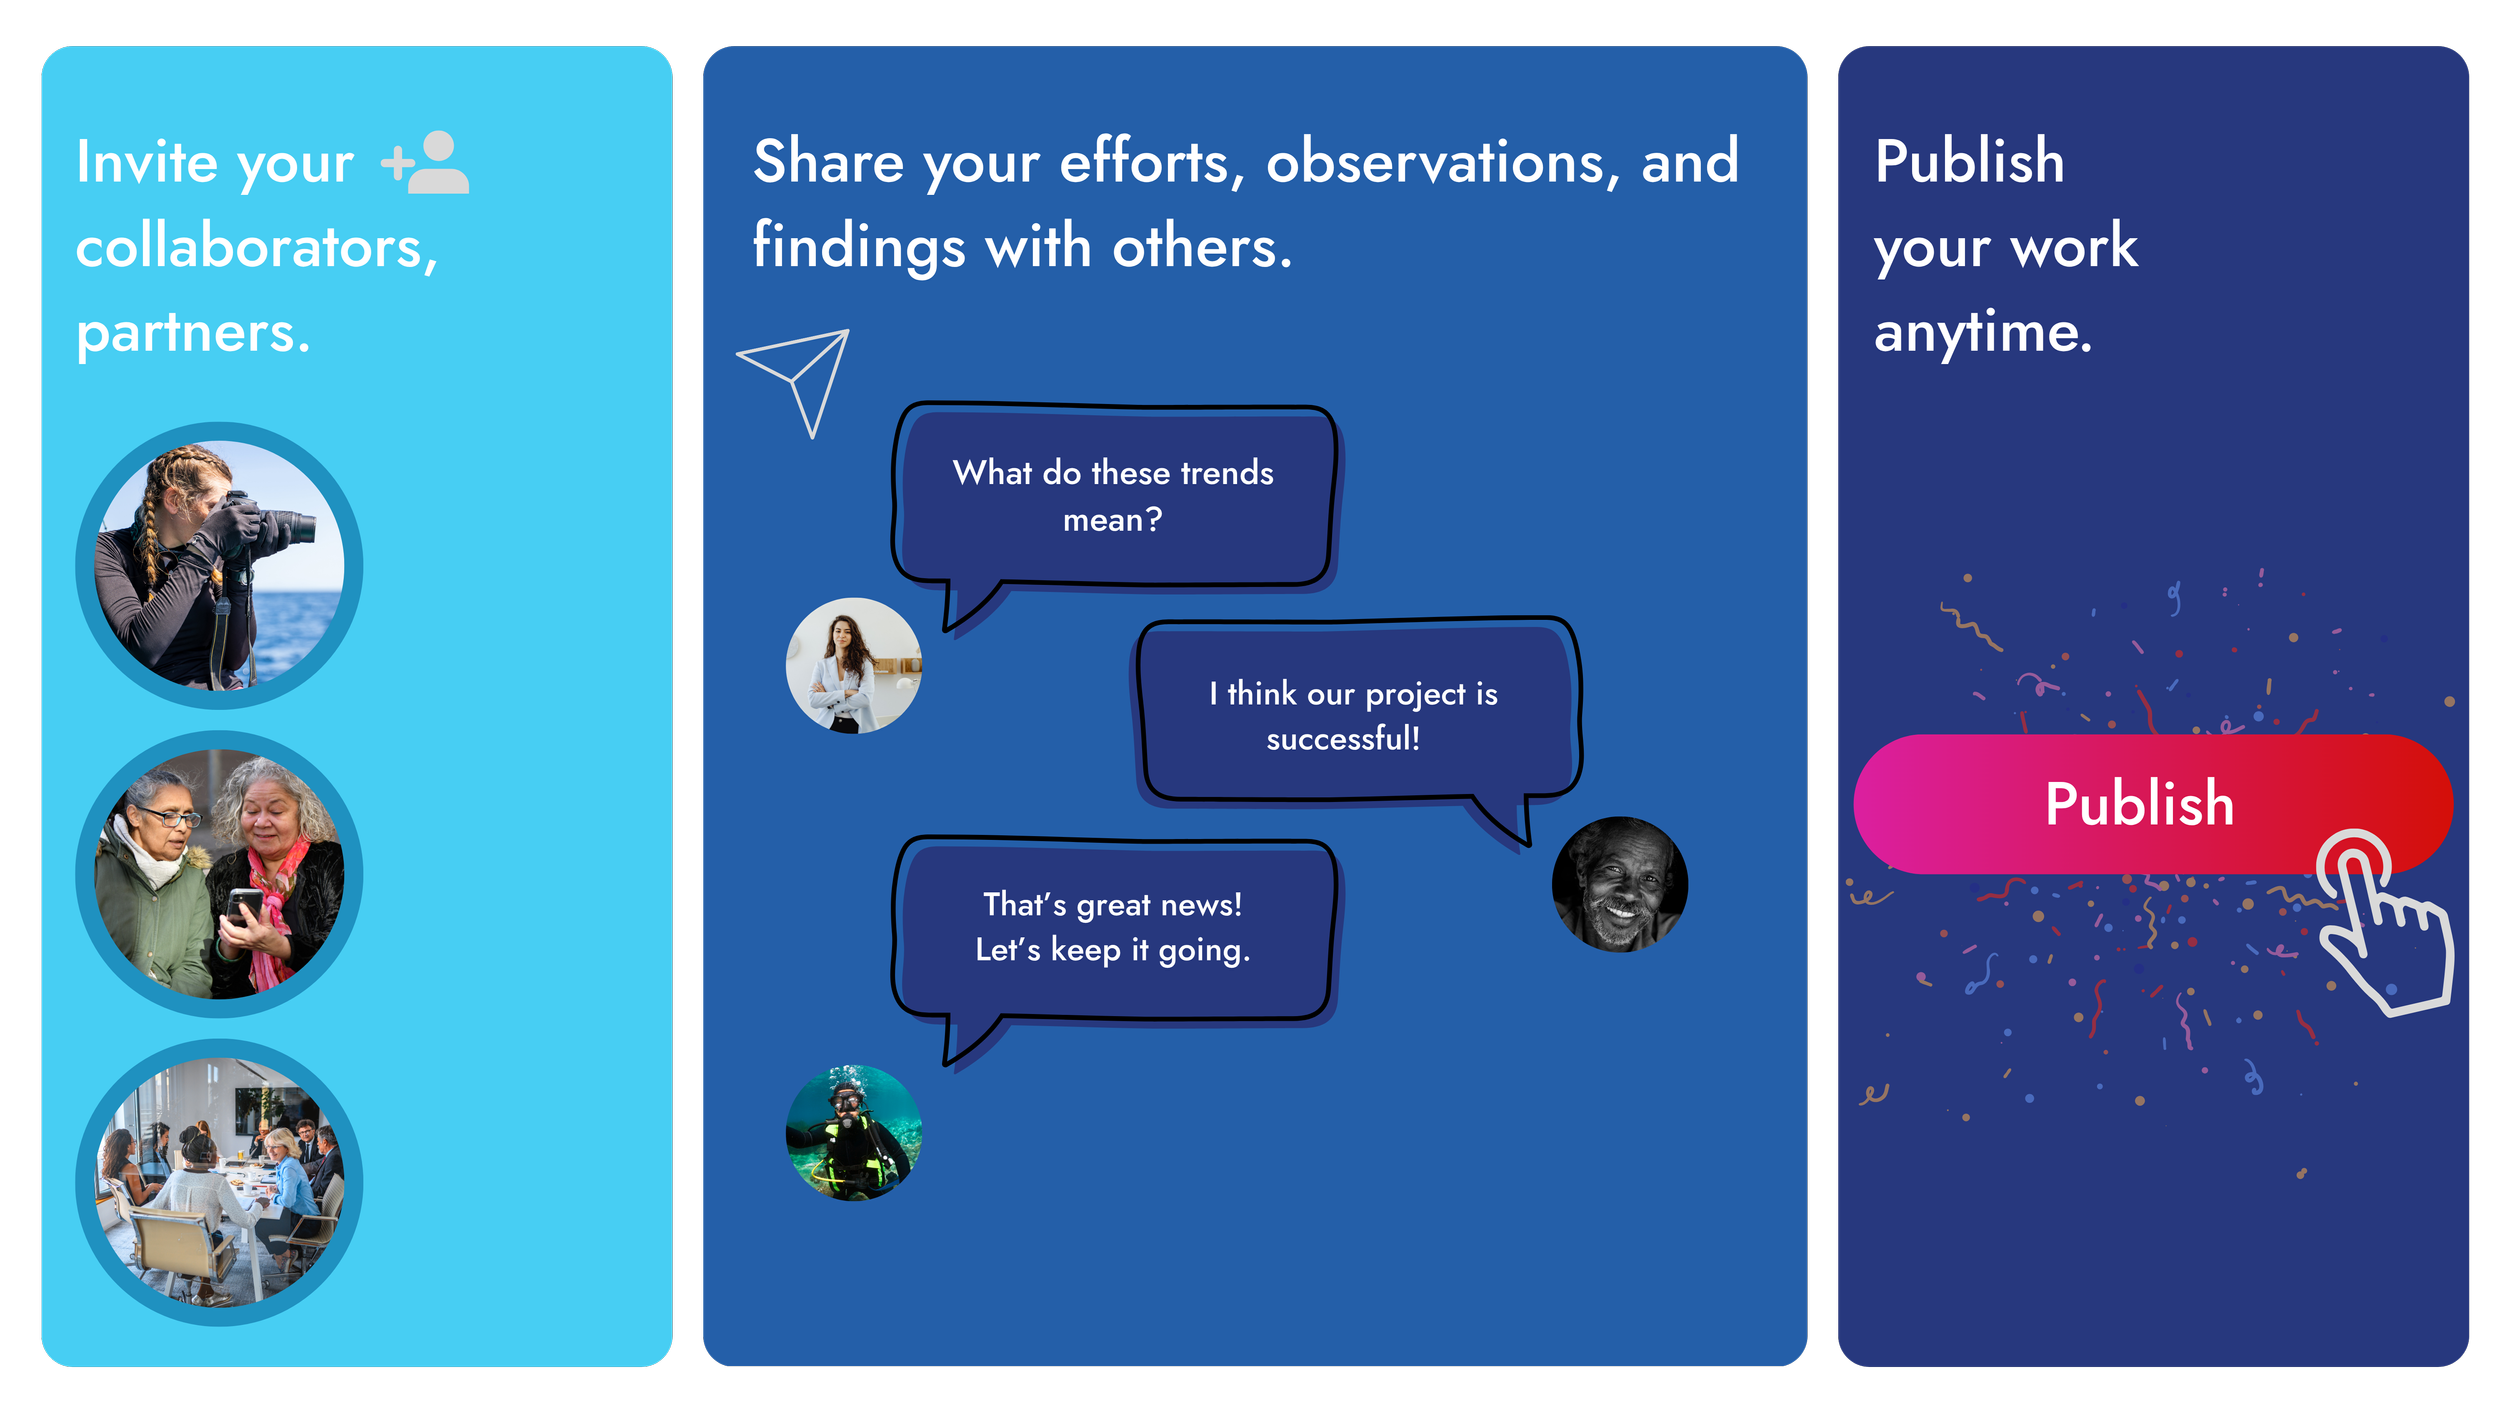
Connect with your audience
Make your projects private or public. Share your evidence and reports with the people who need them—while keeping control of your data. Choose what you share, with whom, and when.
From impact assessments to long-term monitoring, reporting, and research, generate the insights needed for decisions, investments, approvals, action, and accountability.
Blue Economy
Support sustainable ocean industries, fisheries, aquaculture, marine tourism, and coastal resource management with connected evidence for operations, impact assessment, and decision-making.
Research & Science
Accelerate research across species, ecosystems, and environmental conditions. Standardize data collection, connect datasets, automate analysis, and generate reproducible results, reports, and publications.
Environmental Consulting
Complete environmental impact assessments, baseline studies, monitoring programs, compliance reporting, and environmental audits faster. Reduce repetitive data processing and reporting while delivering rigorous, defensible results to clients.
Wildlife Management
Support wildlife and fisheries monitoring, biodiversity assessments, conservation programs, protected areas and marine protected areas (MPAs), and ecotourism. Connect observations across species, sites, human activities, and time to assess ecosystem health, track management effectiveness, and inform conservation decisions.
Nature Finance
Track biodiversity, ecosystem condition, conservation outcomes, and nature-related indicators to support natural capital assessments, nature-positive investments, environmental performance reporting, and the monitoring of funded projects.
Insurance & Risk
Assess environmental hazards, ecosystem condition, and exposure across assets and locations. Connect field observations, monitoring data, and environmental indicators to support risk assessments, resilience planning, underwriting, and insurance decisions.